Detailed View of Valve Widget

Description
The Detailed View of Valve widget displays pressure data from the Integrated Valve driver as well as solenoid state. Instantaneous pressure in and out of the valve are shown as dial gauges. Both data points are charted in the line graph with selectable time span. An On/Off switch is provided for manual operation.
Features / Options
- Pressure shown as dial gauges and graph
- Manual On/Off switch
- Selectable Day, Week, Month graph views
- Crawl time line with cursor for details
General Dashboard and Widget info
Features common to all Widgets and general Dashboard info can be found in the HotSpot widget section of the manual.
Widget Editor Settings
Widget name
Appears top and center of widget.
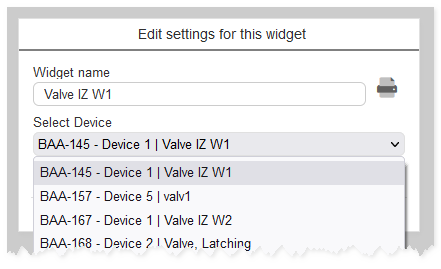
Select Device
The “Select Device” drop-down-menu will list all the ezeio controllers with Integrated Valve drivers in the group the dashboard is on and any groups lower on the same branch of the group tree. Select the desired controller to map the valve data to the widget.
All relevant registers from the driver must be added to Fields
Crawl time line
Move your cursor left to right within the graph and details from the three data points will appear in a caption box.
Select graph span
In the upper right of the graph, a selection can be made for Month, Week or 24 hour time span. The default setting is 24 hours. If changed, the setting will revert to default with the widget reloads