Aggregate Tag Value
General Dashboard and Widget info
Features common to all Widgets and general Dashboard info can be found on the Widgets section of the manual.
Description
The eze.io Aggregated Tag Value widget processes multiple data points with the same tag, to produce a singe value. Aggregation options include; average, sum, minimum, and maximum. This widget is designed for live/instantaneous values. These values could be rapidly changing such as a power reading (kW) or slow like a tank level.
Minimum height - 2 grid units
Features / Options
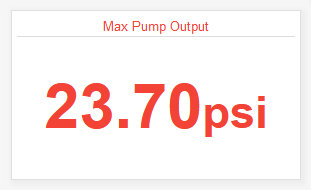
- Numeric value shown with unit
- 4 Aggregation setting (Avg., Sum, Min., Max.,
Settings
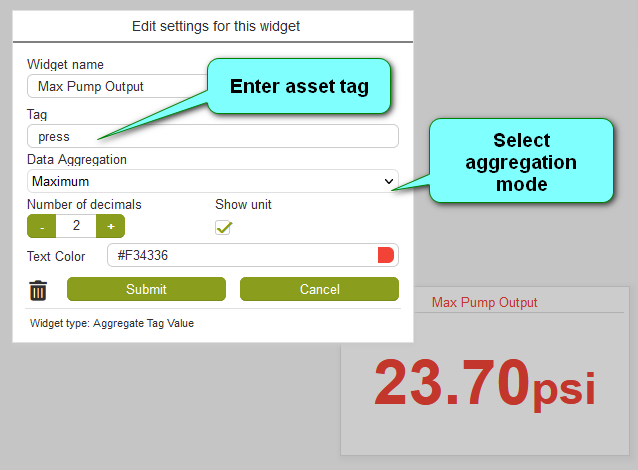
Widget name
Appears top and center of widget
Tag
Enter the “Asset tag” that was assigned to the Fields to be aggregated. For more information on this linking method see the mapping section on the widgets page.
Data Aggregation
A drop-down-menu allows the user to select one of the four data aggregation options described below
- Average - Assign the same tag to two or more Fields and the widget will display the average
- Sum - All Fields with the same tag will added together to produce a total
- Minimum - The lowest value out of all of the Fields with the tag will be displayed
- Maximum - The highest value out of all of the Fields with the tag will be displayed
Text color
Click on the color swatch to access the color palette and select a color for the range bar