This is an old revision of the document!
Dashboards
Located on the “Manage” level of the eze.io user interface, Dashboards are designed as a place to curate collections of data, graphically displayed with “Widgets”. Widgets can be arranged in a way that make it easier for users to understand. Multiple Dashboards can be used to group by location, asset, team, etc. Or use one for an overview and additional Dashboards to provide a deeper look into specific systems/equipment.
Dashboards Features
- Create multiple “Dashboards” in each Group or Account
- Display data from multiple devices, Including data from subgroups.
- Control from Dashboard via; Switch, Button and Field value editor Widgets
- Restrict user access and/or editing privilege per Dashboard
- Show map of ezeio controllers in Group and Sub Groups
- Show external applications, such as weather or Internet connected video camera
- Expand to show full screen
Dashboards Tools
—

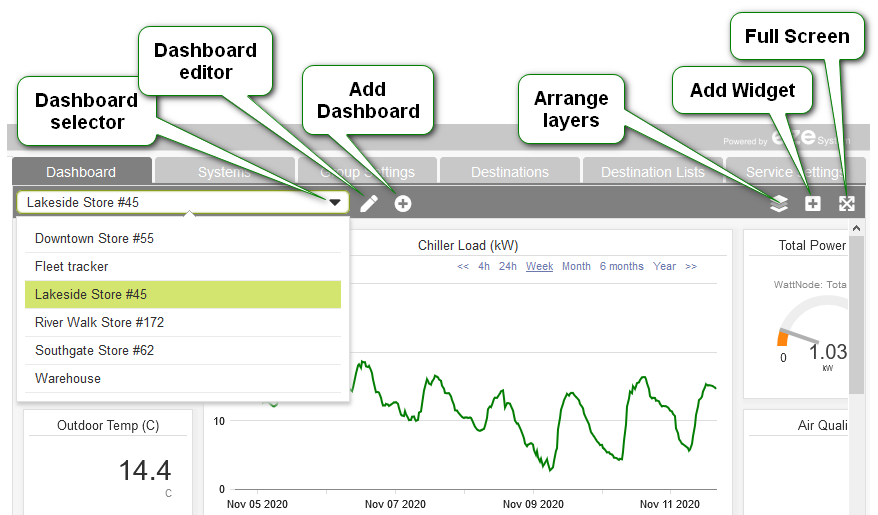
Dashboard Selector
This drop-down menu lists (in alphabetical order) all the Dashboards available to the user.

Dashboard Editor
Clicking the pencil icon will bring up the Edit Dashboard Settings dialog box (shown below). The following settings can be edited through this dialog box.
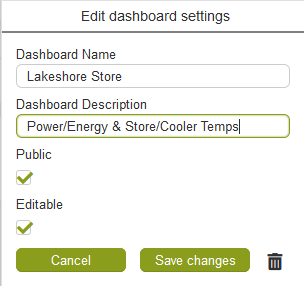
- Edit the currently selected Dashboard's Name and/or Description using the fields supplied.
- Unchecking the “Public” check box restrict viewing access of the Dashboard to the creator.
- Unchecking the Editable check box restricts editing of the Dashboard to the creator. These check boxes are checked by default. In this default state, viewing and editing access is based on a users privileges'.
- The trash can icon will bring up a Delete Dashboard? dialog box. Click the “Delete” button to confirm or the “Cancel” button to return to Edit Dashboard Settings.
Add Dashboard
Click the circle with plus sign icon to add a new Dashboard. Edit the new Dashboard's settings or start building the Dashboard by adding Widgets (see Add Widgets below).
Add Widgets
Click the Add Widget icon (square with plus sign) see a list of available Widgets. The standard list includes; line graphs, bar graphs, dial gauges, digital value, switches, buttons, maps, and a note Widget.
Expand
Click the Expand icon to view the Dashboard tab as full browser width. Click it again to return to the normal view with the all of the *“Manage” tabs and the “Groups” side bar.
Arrange
Widgets can be stacked one on top if the other. To take full advantage of this feature you may need to arrange the layer order of some widgets. Click on the “Layer icon” to see a list of Widgets by layer order. Simply Click-Hold-Drag the Widget to a high or lower position on the list (top of list = top layer).