Table of Contents
Davis Weather Station Widget
Description
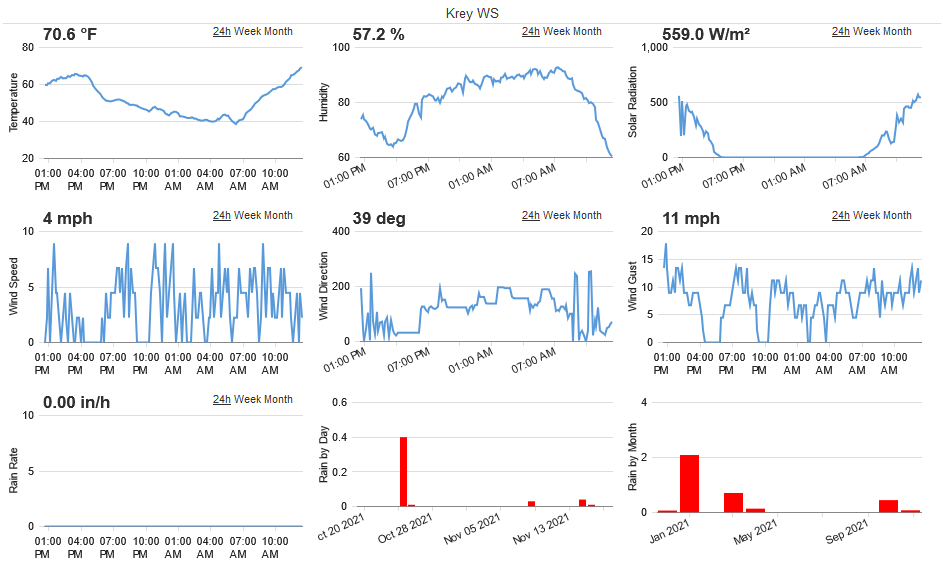
The Davis Weather Station widget displays data from the Davis Instruments “Vantage Pro2”. The widget is comprised of 9 charts, 7 of which have accompanying instantaneous or calculated numeric values (see list below). The data from up to 6 sensors is
Instantaneous Values
- Temperature (as Fahrenheit)
- Relative humidity (as percentage)
- Wind speed (as miles per hour)
- Wind direction (as degrees)
- Solar radiation (as Watts per meter squared)
Captured or calculated values
- Wind gust
- Rain fall (as inches per hour)
Charts
- Temperature
- Relative humidity
- Solar radiation
- Wind speed
- Wind direction
- Wind gusts
- Rain fall rate
- Rainfall by day
- Rainfall by month
Features
- Day, Week, Month graph view
- Crawl time line with cursor for details
General Dashboard and Widget info
Features common to all Widgets and general Dashboard info can be found in the HotSpot widget section of the manual.
Widget Editor Settings
Widget name
Appears top and center of widget.
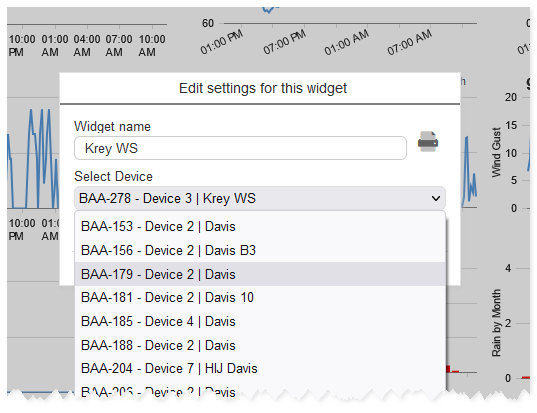
Select a weather station
The “Select Device” drop-down-menu will list all the ezeio controllers with Davis Weather Station drivers in the group the dashboard is on and any groups lower on the same branch of the group tree. Select the desired controller to map the weather data to the widget.
All relevant registers from the driver must be added to Fields
On Screen Controls / Functions
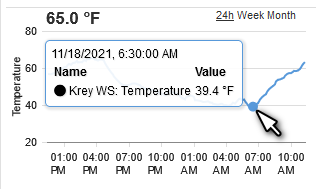
Crawl time line
Move your cursor left to right within one of the graphs and details from individual data points will appear in a caption box.
Select graph span
In the upper right of each graph (excluding “Rain by Day” and “Rain by Month) a selection can be made for Month, Week or 24 hour time span. The default setting is 24 hours. If changed, the setting will revert to default with the widget reloads