Table of Contents
Bar Graph
General Dashboard and Widget info
Features common to all Widgets and general Dashboard info can be found in the Dashboards section of the manual.
Description
The eze.io Bar Graph widget displays total accumulation over a user selected time frame, ranging from hourly to monthly. Up to 5 data points can be tracked. This widget is best suited for comparing or tracking usage, for example water or energy.
Minimum height (grid units) - 3
Features / Options
- Up to 5 data points
- 7 User selectable time frames
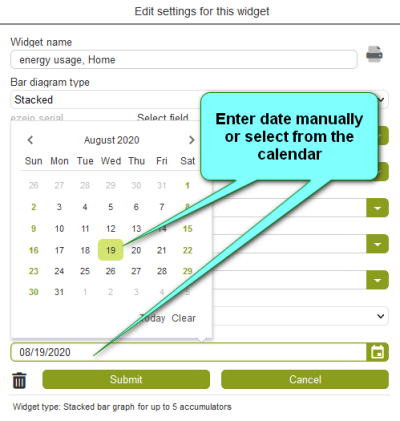
- Selectable timeline cutoff (“Do not show data before this date”)
Settings
Widget name
Appears top and center of widget
Select Bar Diagram Type
Select field/s
Five drop down menus provide the means to link to a specific “Field”, from the desired ezeio. For more details see the “Point to Field” section of the Widget page.
Select Bar Width and Time Scale
Drop down menu offer the graphical styles listed below
- Hourly, for 24 hours
- 4 Hours, for 4 days
- Daily, for 10 days
- Daily, for 30 days
- Weekly, for 1 year
- 4 weeks, for 2 years
- Calendar month, for 2 years

