Table of Contents
Field Value as Gauge
General Dashboard and Widget info
Features common to all Widgets and general Dashboard info can be found on the Widgets section of the manual.
Description
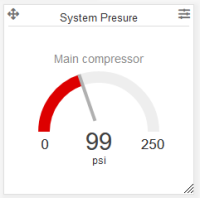
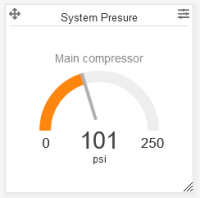
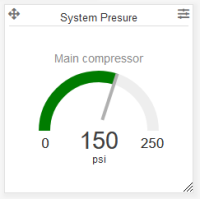
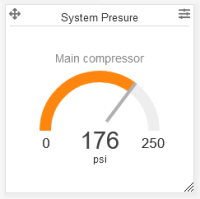
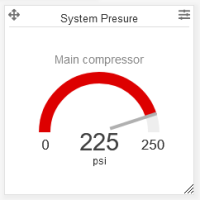
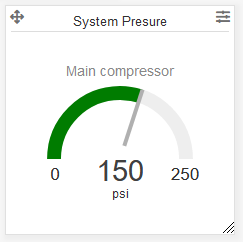
The eze.io Field Value as Gauge widget displays the current value of a single field as a dial gauge, similar to the analog gauges on an old car or instrument panel. The numeric value is shown in the center of the widget and a pointer indicates where the value is position in the define range. The area to the left of the sweeping pointer is filled with a user defined colors. Three colors can be assigned to a maximum of 5 segments of the range. This widget is designed for live/instantaneous values. These values could be rapidly changing such as a power reading (kW) or slow like a tank level.
Minimum height (grid units) - 2
Features / Options
- Numeric value & range displayed
- Up to 5 range segments (max of 3 colors)
- Field name and engineering unit shown
Settings
Widget name
Appears top and center of widget
Select Field
A drop down menu provides the means to link to a specific “Field”, from the desired ezeio. For more information see mapping on the widgets page.
Item Color
Select the main or lowest color layer by clicking on the color swatch. This opens the color palette. Select the desired color and the palette will close. This color can be displayed at the beginning and end of the gauges range.
The range of the gauge is set by the “Minimum” and “Maximum” setting in the Field's configuration

Middle Range
Define the middle range and select a color (using the same method described above). In terms of color layers, the middle range lies between the item color (back) and the “Inner Range” color (top). In the example below this range is represented in orange.
Inner Range
Define the inner range and select a color. In terms of color layers, the inner range color is the top. In the example below this range is represented in green.
In the example above, two ranges are entered. The third range (full sweep of the gauge) comes from the field's min and max setting. The widget setting's allow three colors to be associated with the three ranges. The results is three to five segments of the dial to displaying one of three colors as it completes a full sweep.
