Table of Contents
Circular Gauge Widget
General Dashboard and Widget info
Features common to all Widgets and general Dashboard info can be found on the Widgets section of the manual.
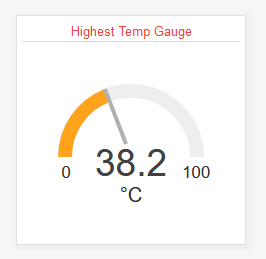
Description
The eze.io Circular Gauge widget processes multiple data points with the same tag, to produce a singe value. That value is presented as a dial gauge, similar to the analog gauges on an old car or instrument panel. Aggregation options include; average, sum, minimum, and maximum. This widget is designed for live/instantaneous values. These values could be rapidly changing such as a power reading (kW) or slow like a tank level.
Minimum height - 2 grid units
Features / Options
- Numeric value & range displayed
- Up to 5 range segments (max of 3 colors)
- Field name and engineering unit shown
- 4 Aggregation setting (Avg., Sum, Min., Max.)
Settings
Widget name
Appears top and center of widget
Tag
Enter the “Asset tag” that was assigned to the Fields to be aggregated. For more information on this linking method see the mapping section on the widgets page.
Data Aggregation
A drop-down-menu allows the user to select one of the four data aggregation options described below
- Average - Assign the same tag to two or more Fields and the widget will display the average
- Sum - All Fields with the same tag will added together to produce a total
- Minimum - The lowest value out of all of the Fields with the tag will be displayed
- Maximum - The highest value out of all of the Fields with the tag will be displayed
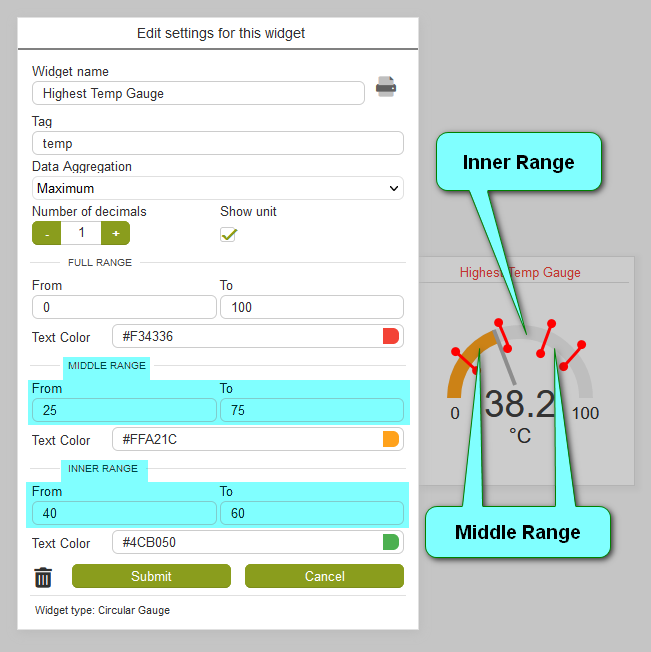
Gauge Colors
The full range of the gauge can be divided into five sections displaying one of three colors. Each range has a layer hierarchy. “FULL RANGE” is the back most layer, next is the “MIDDLE RANGE” and at the top is the “INNER RANGE”. As the pointer sweeps through the range, the colored area to the left will change to the color assigned to that section of the range. If the ranges overlap, then the top most layer/color is displayed.
Full Range
The full range of this widget is driven by this setting, unlike other widgets where the range is set by the Field's min-max settings. The gauge can range from negative to positive, but it will only sweep from left to right. Enter the lower value on the in the “From” box and the higher value in the “To” box. Then click on the color swatch to access the color palette and select a color to represent one or both of the extremes.
Middle Range
As described above, enter the range and select a color to represent the 'MIDDLE RANGE“ & middle color layer.
Inner Range
This is the top most layer, so when the value is within this range the color selected will be shown. Enter the range and select a color as described in “Full Range”.